
- First Name
- Cameron
- Joined
- Apr 2, 2025
- Threads
- 23
- Messages
- 286
- Reaction score
- 417
- Location
- New Mexico
- Vehicle(s)
- 2025 Tacoma TRD OffRoad
- Thread starter
- #1
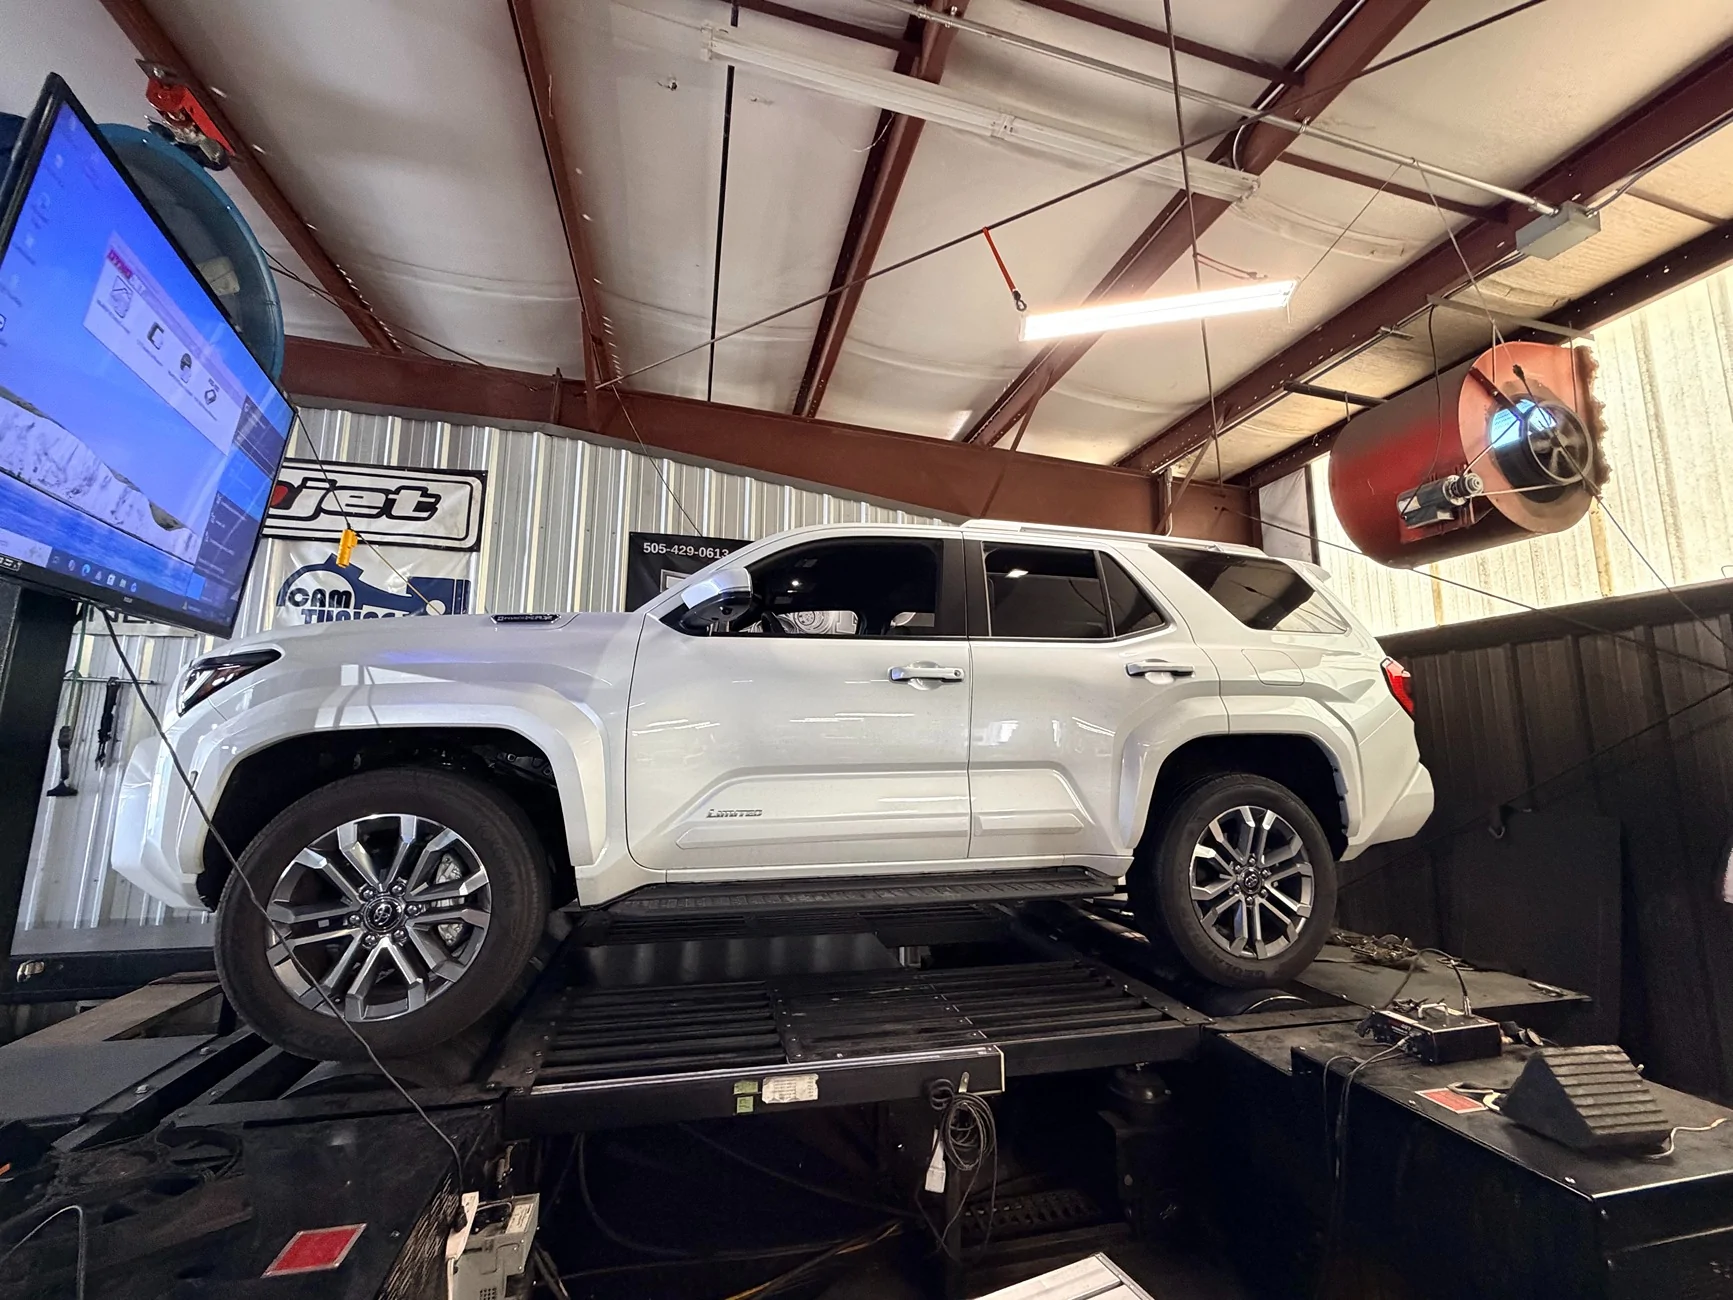
Today I had a completely stock, 4,000-mile 2026 full-time four-wheel-drive 4Runner on the dyno. All testing was completed on 91 octane with the transmission locked in fourth gear for both the stock and tuned pulls.
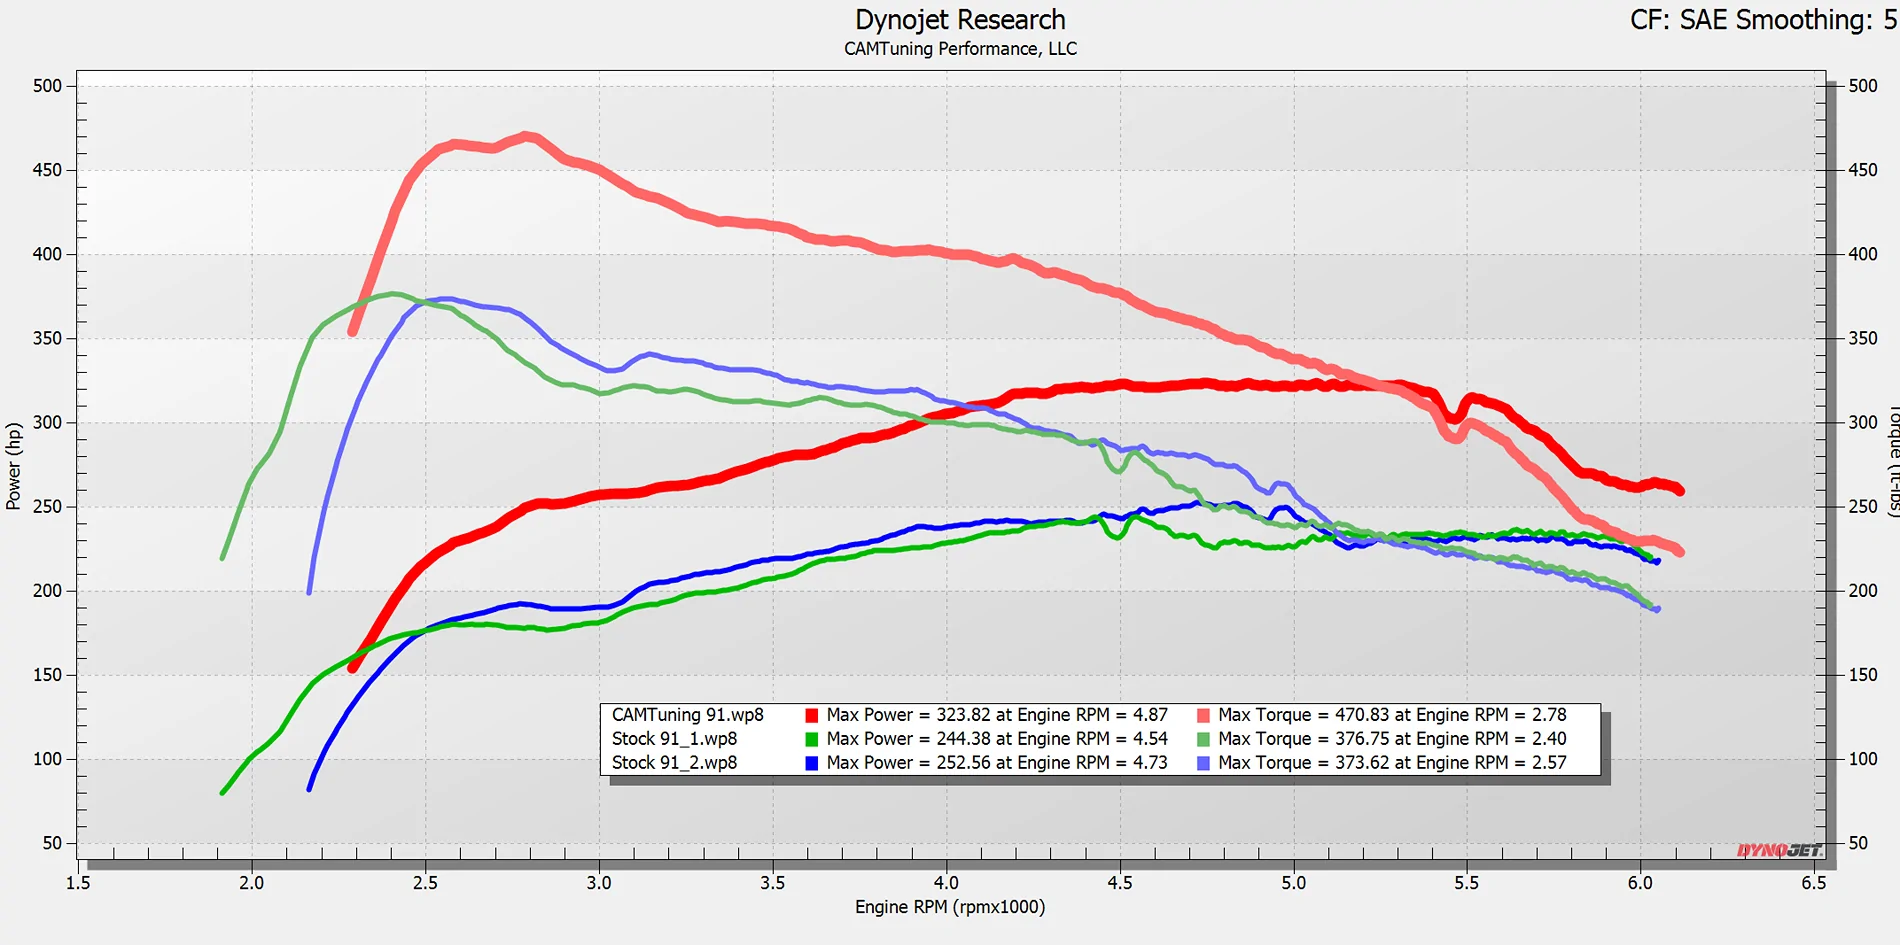
The repeatable stock baseline produced 252.56 wheel horsepower and 373.62 lb-ft of torque. After tuning, it produced 323.82 wheel horsepower and 470.83 lb-ft of torque, for gains of 71 wheel horsepower and 97 lb-ft.
The peak numbers are strong, but the bigger story is the improvement throughout the entire usable powerband. From 3,000 to 4,000 rpm, the tune averaged approximately 60 additional wheel horsepower and 91 lb-ft of torque. From 4,000 to 5,000 rpm, the average gain increased to approximately 75 wheel horsepower and 87 lb-ft. Even from 5,000 to 6,000 rpm, it still averaged roughly 72 wheel horsepower and 70 lb-ft more than stock.
The largest measured torque improvement was approximately 117 lb-ft at 3,000 rpm. The largest horsepower difference was approximately 96 wheel horsepower at 5,200 rpm, where the tuned run was still producing more than 322 wheel horsepower compared with approximately 227 wheel horsepower stock.
That is what makes the result more meaningful than the peak numbers alone. The tune adds a substantial amount of torque through the low and midrange, then continues carrying significantly more horsepower as rpm increases. This is not a narrow gain at one point on the graph. The entire curve is improved.
I also included the first stock pull to show something I consistently observe on these trucks: the first pull usually makes less power than the following pull. This one made 244.38 wheel horsepower compared with 252.56 on the second stock pull.
I intentionally did not use the lower first pull as the baseline. I have seen people use that weaker first run in a stock-versus-tuned comparison because it makes the gains look larger, but I do not consider that an honest representation of the result.
I do my best to begin each dyno sample at the same engine speed so the curves line up and the comparison is easy to read. On the first stock pull, however, I unintentionally began the sample at a lower rpm, which is why that curve is visibly shifted to the left. Starting a pull earlier will also usually produce a higher low-end torque reading on the dyno because the vehicle has more time to build load before reaching that portion of the curve.
This is another detail worth paying attention to when reviewing dyno charts. Differences in where the sample begins can change the apparent shape and low-end torque of the graph, even when the vehicle itself has not changed.
There is also a noticeable dip near the upper end of the pull. It appears on both the stock and tuned calibrations and can be felt from the driver’s seat. My current suspicion is a reduction or transition in hybrid motor assist, or another factory torque-management event. I would need more hybrid-system data before calling the exact cause, but it is clearly not something introduced by the tune and it is not just a graphing artifact.
While this was performed on the dyno, the vast majority of my customers are tuned remotely, using the same methodology. Flash- log- review- revise, repeat.


The repeatable stock baseline produced 252.56 wheel horsepower and 373.62 lb-ft of torque. After tuning, it produced 323.82 wheel horsepower and 470.83 lb-ft of torque, for gains of 71 wheel horsepower and 97 lb-ft.
The peak numbers are strong, but the bigger story is the improvement throughout the entire usable powerband. From 3,000 to 4,000 rpm, the tune averaged approximately 60 additional wheel horsepower and 91 lb-ft of torque. From 4,000 to 5,000 rpm, the average gain increased to approximately 75 wheel horsepower and 87 lb-ft. Even from 5,000 to 6,000 rpm, it still averaged roughly 72 wheel horsepower and 70 lb-ft more than stock.
The largest measured torque improvement was approximately 117 lb-ft at 3,000 rpm. The largest horsepower difference was approximately 96 wheel horsepower at 5,200 rpm, where the tuned run was still producing more than 322 wheel horsepower compared with approximately 227 wheel horsepower stock.
That is what makes the result more meaningful than the peak numbers alone. The tune adds a substantial amount of torque through the low and midrange, then continues carrying significantly more horsepower as rpm increases. This is not a narrow gain at one point on the graph. The entire curve is improved.
I also included the first stock pull to show something I consistently observe on these trucks: the first pull usually makes less power than the following pull. This one made 244.38 wheel horsepower compared with 252.56 on the second stock pull.
I intentionally did not use the lower first pull as the baseline. I have seen people use that weaker first run in a stock-versus-tuned comparison because it makes the gains look larger, but I do not consider that an honest representation of the result.
I do my best to begin each dyno sample at the same engine speed so the curves line up and the comparison is easy to read. On the first stock pull, however, I unintentionally began the sample at a lower rpm, which is why that curve is visibly shifted to the left. Starting a pull earlier will also usually produce a higher low-end torque reading on the dyno because the vehicle has more time to build load before reaching that portion of the curve.
This is another detail worth paying attention to when reviewing dyno charts. Differences in where the sample begins can change the apparent shape and low-end torque of the graph, even when the vehicle itself has not changed.
There is also a noticeable dip near the upper end of the pull. It appears on both the stock and tuned calibrations and can be felt from the driver’s seat. My current suspicion is a reduction or transition in hybrid motor assist, or another factory torque-management event. I would need more hybrid-system data before calling the exact cause, but it is clearly not something introduced by the tune and it is not just a graphing artifact.
While this was performed on the dyno, the vast majority of my customers are tuned remotely, using the same methodology. Flash- log- review- revise, repeat.
Sponsored